Event Statistics Report
An Event Statistics Report provides a quantitative view of the classifications data recorded against the Events captured in the report search, as well as for the related records of a single Entity (typically Stakeholders or Properties).
Required System Role: Standard User
Required Team Role: Viewer
This report is commonly used to review the nature of monthly engagement, including what channels engagement has been occurring through and what issues are most prevalent.
The data will be provided in a Word document, including editable tables and charts.
How to run an Event Statistics Report
To generate an Event Statistics Report, go to the Reports section and choose Statistics. You will find two options to select from: 'New Statistics Report' and 'New Event Statistics Report'.

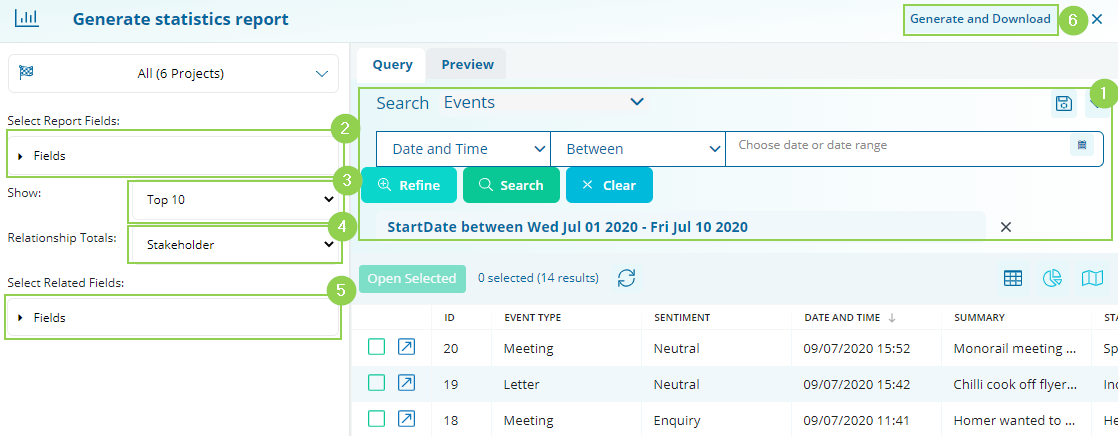
Once in the report designer, you can select inclusions such as which Projects to draw data from, which fields to include from the Events, how much of your data you want to include and other details.

-
Search: Apply search parameters to define which Events the report should include
-
Report Fields: Select fields to include from the Events Records
-
Show: Select how many classifications from each field should appear on the report
-
Relationship Totals: Select which related Entity you want to include on the report
-
Related Fields: Select fields to include from the Related Records
Search: Apply search parameters to define which Events the report should include
Once you have made your selections, click [Generate & Download] (6) to create the report.
Once generated, the report shows each field on a different page, with:
-
A pie chart (editable) showing the occurrences of the classification, corresponding with
-
a table showing the counts represented in the chart as well as
-
the number of distinct (unique) related records and
-
the total number of related records.
The final row in the table displays the "Total" as the sum total of the numbers mentioned above, rather than representing the overall count of distinct (individual/unique) Stakeholders.
