How to set up mapping layers
Layers are sets of data captured in a search and visually displayed on your map.
Layers are sets of data captured in a search and visually displayed on your map. Any record that contains an address is a "mappable" record that can be searched for and therefore can be included in a Layer. You can toggle your Layers on and off, which lets you compare only relevant information. To differentiate your Layers, you can also customise the icons, and use the heatmap or cluster format.
We would recommend customizing your Project Base Maps before adding in your Layers so you can see your data in the appropriate context.
Customising your Map Layers
First, go to Maps, which you can find in the main navigation bar at the top of the screen.

Before adding layers, it is recommended that you adjust the map view if required
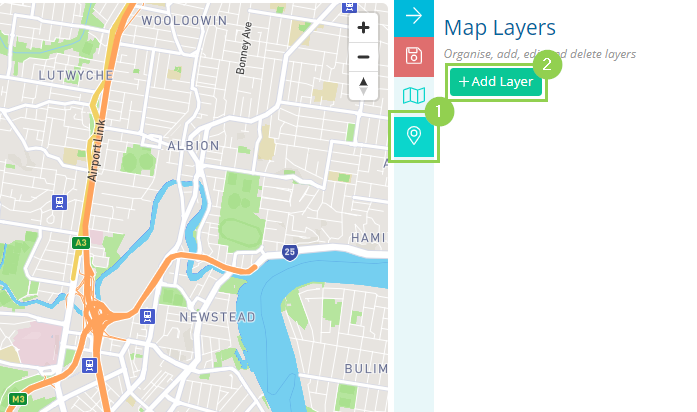
Next, Select the Map Layers Icon (1), and click Add Layer (2).
You will be able to map three different layer types, Point, Line and Polygon, each with its distinct options.
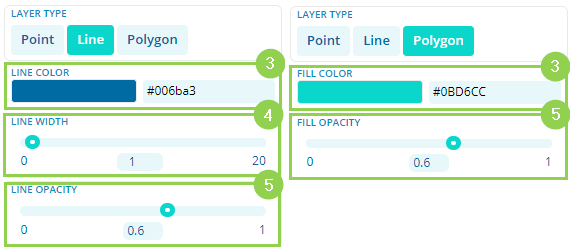
When plotting Lines and Polygons, you have the options to:
3. Customise the colour
4. Customise the line width
5. Customise the opacity
Customising your Point Marker
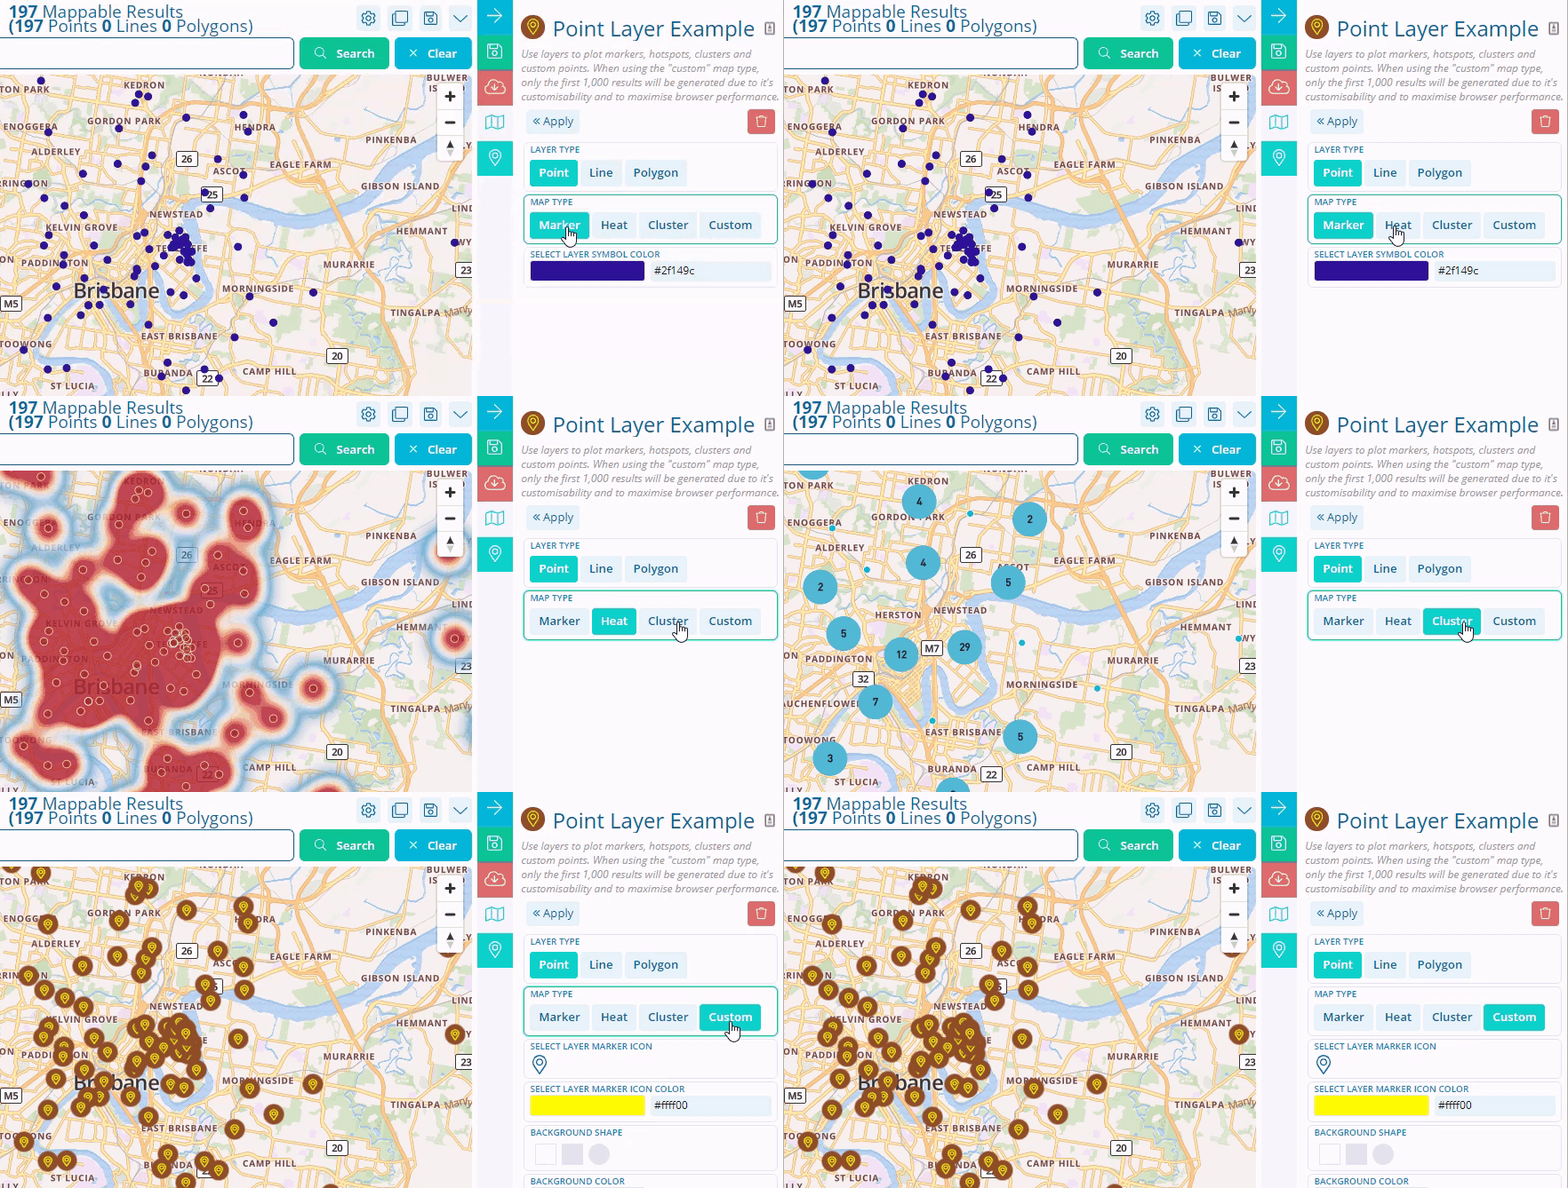
Choosing the Point layer type allows you to map your Records in four different ways- Marker, Heat, Cluster and Custom.
Here is a quick explanation of each of these ways
Marker: Records show up as a clickable point. The colour can be customised.
Heat: Records show up as a heat map, where the geographical density of records are represented with a red colour.
Cluster: Geographically similar records are clustered together which allows you to see patterns in your data.
Custom: Records show up as a clickable point.
Please refer to the map below to see the four different layer types.
When plotting the Marker and Custom map type, you have to options to:
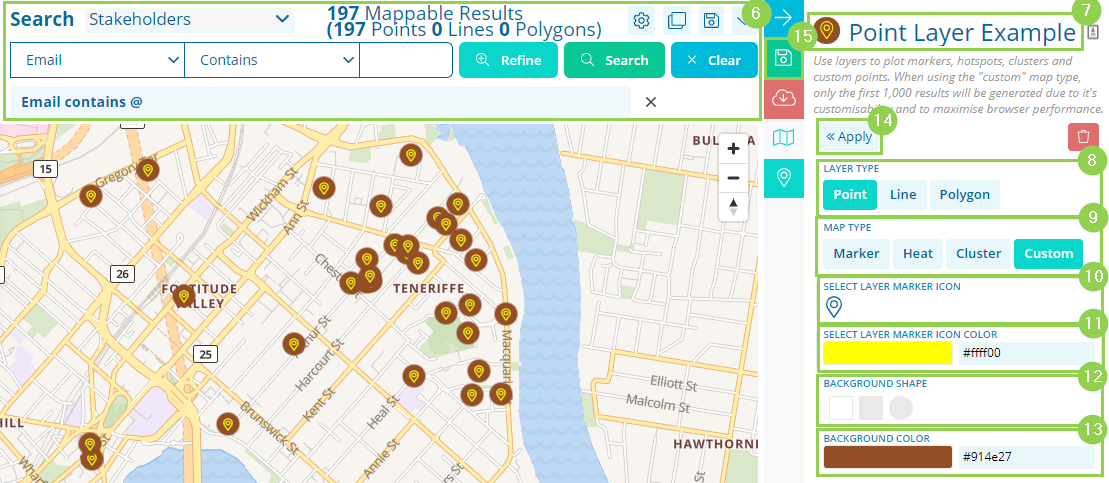
6. To choose which records are plotted on the map with your layer, use the main search area at the top to run your search.
After running your search, the map will populate with the resulting records.
7. Click the Layer name to edit it.
8. Select Map Marker Type. Choose from Marker, Heat and Cluster (refer to GIF above for differences).
Heat and Cluster types do not have additional settings. But if you were to choose the Marker type, you will be able to customise your Layer Marker Icon
9. Select your Map Type: Marker, Heat, Cluster and Custom.
10. Select Layer Marker Icon. There are over 200 icons you can choose from!
11. Select Layer Marker Icon Colour. Choose your colour in the pop-up, you can also type in a Hex code.
12. Select Background Shape. Choose between a square and a circle. The first white square is a transparent background option.
13. Select Background Colour. Choose your colour in the pop-up. You can even type in a Hex code to match your markers to corporate colours.
14. Click Apply.
15. Click Save. Clicking the save is very important. Failure to do so will result in your changes not being saved to the database.
How to view your Map Layers
After your map layer has been saved it can be selected or deselected to be displayed alongside other map layers.
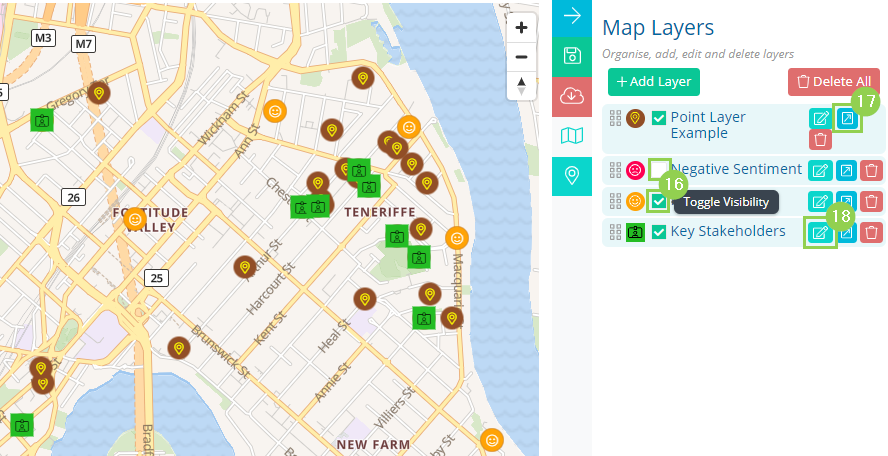
16. The checkbox can be used to toggle visibility. As these layers represent certain searches in the system. Using layers, you will be able to save and display searches across multiple entities simultaneously on the same map.
This allows you to compare and contrast different layers in real-time. (Layers are automatically updated when a new record belongs to your search)
17. Open layer in search. This pulls out the search that was made to make this layer on the search grid.
18. Edit any existing layers you have.
You may also use the blue button (17) to open up the layers search in the search grid and 18 to edit the layer.