Impressions by Event Type Report
This analytical report shows how many Events have occurred along with how many 'impressions' those Events have made.
Required System Role: Standard User
Required Team Role: Viewer
What is an Impressions by Event Type Report?
This analytical report shows how many Events have occurred along with how many 'impressions' those Events have made.
Impressions: The total number of Stakeholders that are linked to your Events. This might count the same Stakeholder more than once if they are linked to multiple Events.
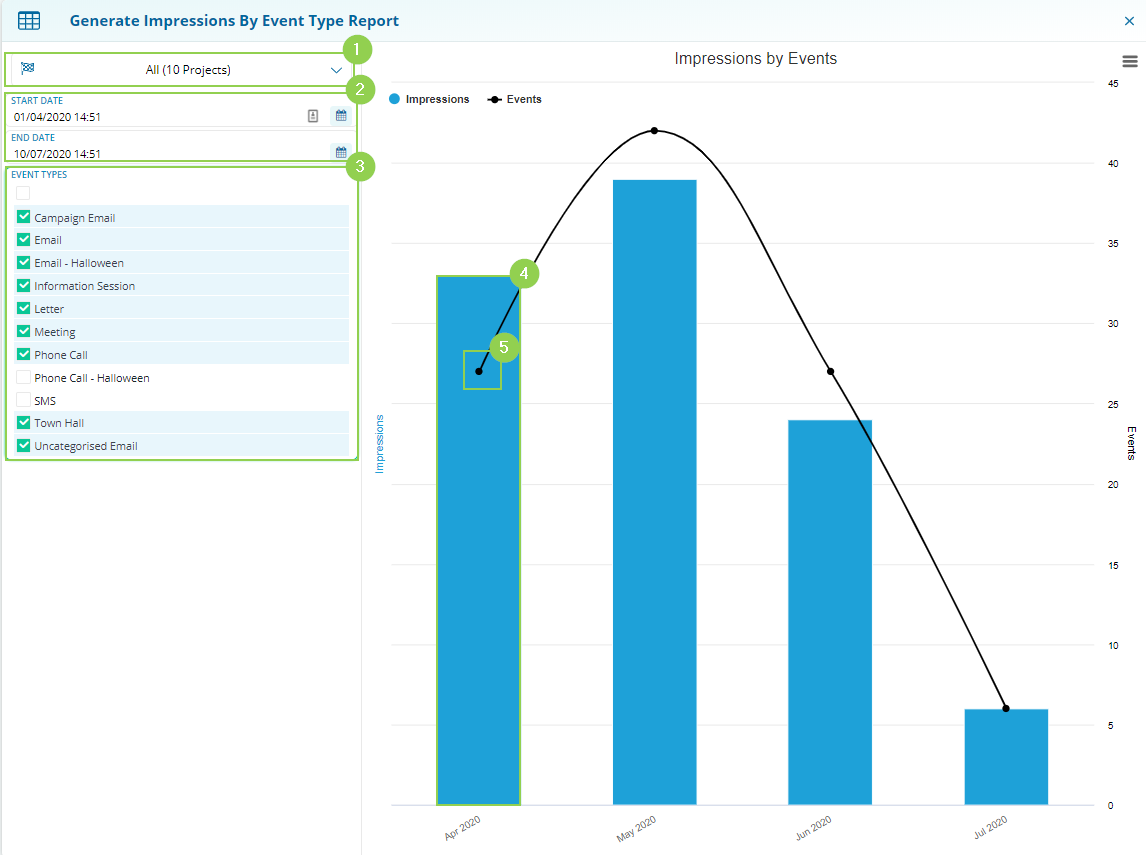
You will be able to run this analytical report by choosing three variables:
-
Projects: Define a Project selection to filter the displayed data to only Events in those Projects.
-
Date: Select the date range of the Events you are reporting on.
-
Event Types: Select the Event Types you wish to report on. Only Events belonging to the Event Types you have selected will be displayed.
After selecting your variables:
-
The blue bar graph displays your Impressions.
-
The black dot displays the number of Events.
Why Impressions by Event Type Report?
This Report is the quickest way to quickly analyse the effectiveness of your various Event Types, including the average Reach of a single Event.

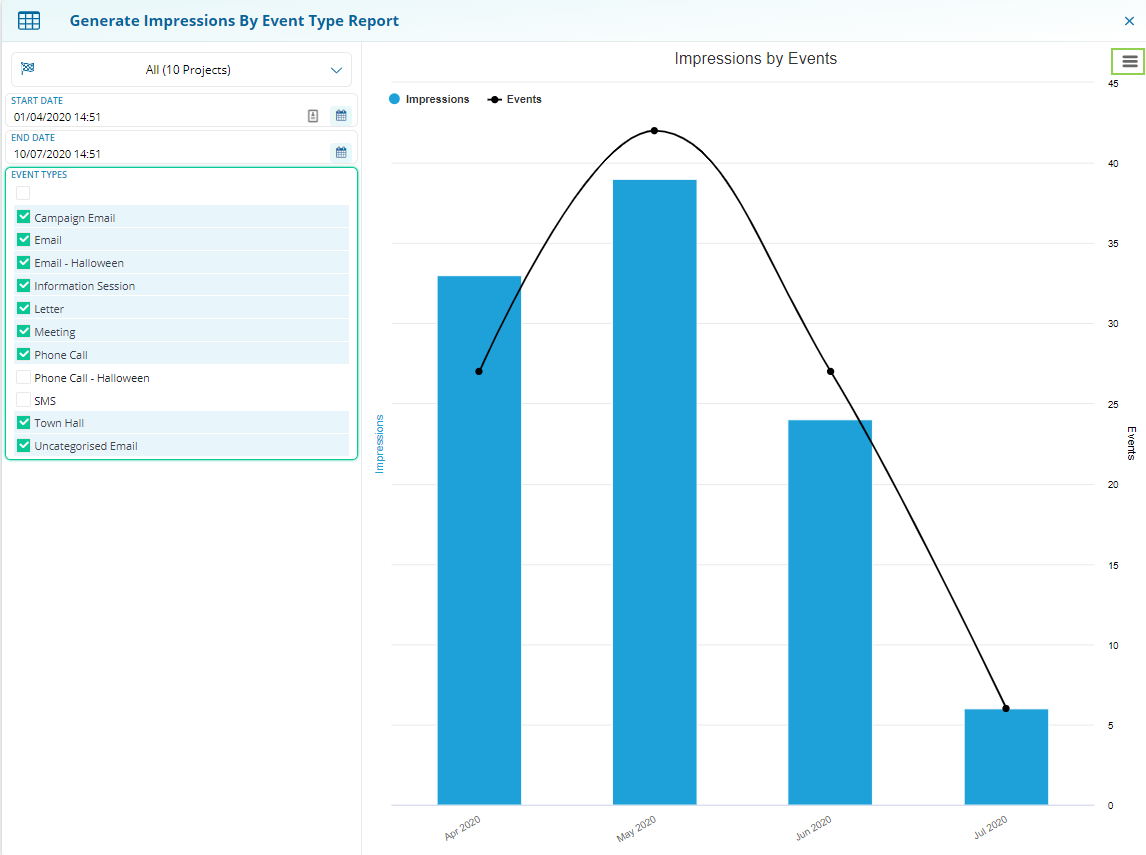
The above is what typical impressions by Event Type Report might look like across all your Projects,
where impression counts are typically higher than the number of Events.
Although Impression counts are typically higher than Event numbers, your report may show:
High Impression count, Low Event number: Each Event is linked to many stakeholders. Event Types that may show these results include Email Campaigns and Community Open Days.
Equal Impression count and Event number: We can infer from this result that most interactions were 1 to 1 Consultations of some sort.
Low Impression count, High Event number: This may indicate that a large number of Events in your system have no related Stakeholders. Stakeholders might not be accurately linked to your Events, or your Events may have been intentionally recorded with no Stakeholder.
Note: Events and Impressions are displayed in monthly groupings. A date range selection of the 22nd of May to the 30th of June (10 Days May, 30 Days June) may offer skewed results because the chart will only be displaying 10 days of May.
