The CM Dashboard
Understanding the different elements of your dashboard and how it can help you with your day-to-day responsibilities
Required System Role: Standard User
Required Team Role: Viewer
Your Dashboard is the first thing you will see when you log into CM4. It will give you valuable information about your CM system in general, as well as things that may need your attention.


-
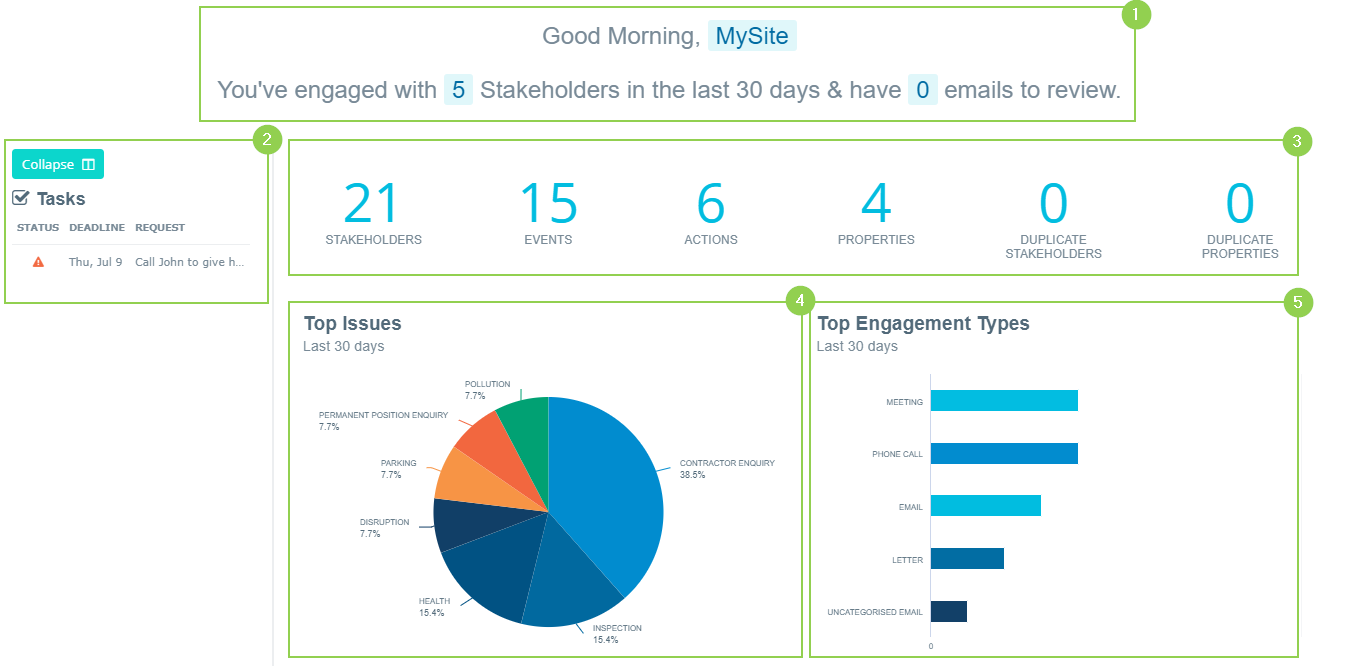
Personalised info: This is where you’ll get some information about how many Stakeholders your account has interacted with in the last 30 days, and if there are any emails you have to categorise. Have a look at our Inbound Email section to find out more about this functionality.
-
Tasks: This shows how many outstanding Actions you have assigned to you. Hover over the request text to see more information.
-
Record counts: This shows how many of each Entity you have in your system. It also gives an indicator of how many Duplicates you have and may need attention.
-
Top Issues: This shows the top Issue reported on all Events entered in the system in the past 30 days.
-
Top Engagement Types: Indicates the top methods you’re interacting with your Stakeholders.
-
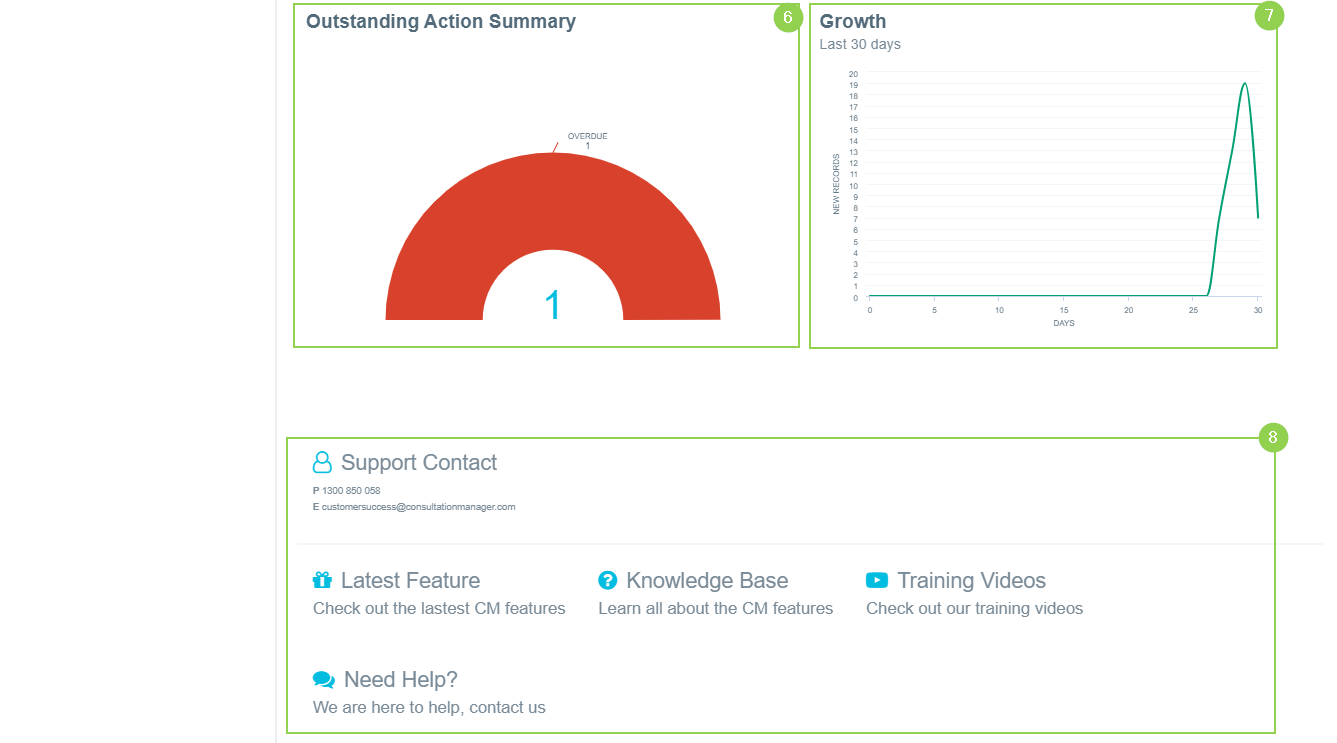
Outstanding Action Summary: Linked to your Tasks, it shows how many Actions you currently have outstanding. If the graph is green, you’ve still got some time to complete them, if it’s orange or red, you’ve got a few overdue Actions that need your attention!
-
Growth: Gives an indication of how much data has been entered into the system over the past 30 days. It will allow you to see trends if data input is increasing as expected or decreasing and you may need to send a reminder to Users to make sure their data is up to date!
-
Support: This is where you can find some information on how to contact CM Support if you have any questions, access training videos, and find out about our latest features.