What is a Statistics Report?
A Statistics Report is a Word document which summarises Classification data for a selected Entity, showing statistics against data like issues, groups, and other related information.
Required System Role: Standard User
Required Team Role: Viewer
A Statistics Report is most commonly used to report on Events during a certain period which will show you an overview of who you’re engaging with, what you’re engaging with them, and through what channels. You can also choose to add related classification fields from another Entity. For example, add Stakeholder Groups and Distribution Lists to an Event Statistics Report for insight into the Stakeholders who engaged during that period.
The data will be provided in a Word document, including editable tables and charts.
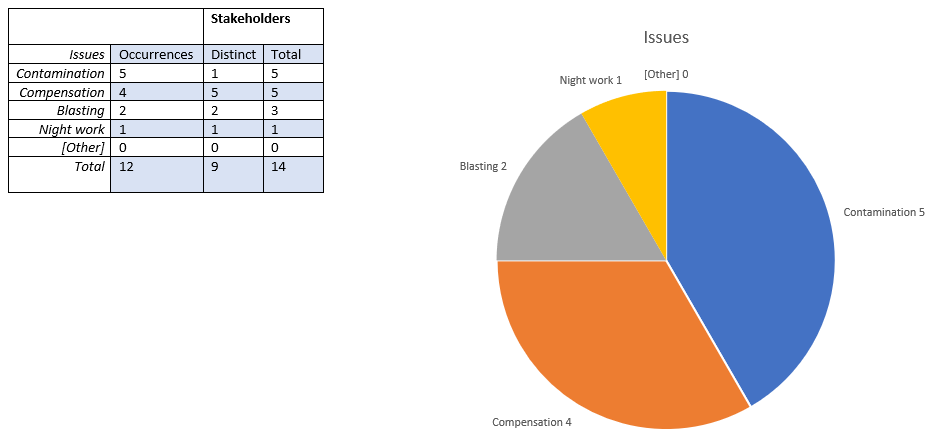
Once generated, the report shows each field on a different page, with a pie chart (editable) showing the occurrences of the classification, corresponding with a table showing the counts represented in the chart.
The columns in the table are:
-
Occurrences: The number of Events that classification was tagged on.
-
Distinct: The number of unique Stakeholders involved in those Events.
-
Total: The number of Stakeholders involved in those Events, even if it’s the same Stakeholder repeatedly engaging.
In the example below, we can see that the top Issue is one of Contamination, however there is only 1 unique Stakeholder who has raised this Issue. We can infer from the below that this Stakeholder is particularly vocal and that Contamination is not a widespread issue.
On the other hand, we can see that Compensation has been raised on four Events, by five Distinct and five Total Stakeholders. This suggests that this is a widespread issue or concern for Stakeholders.

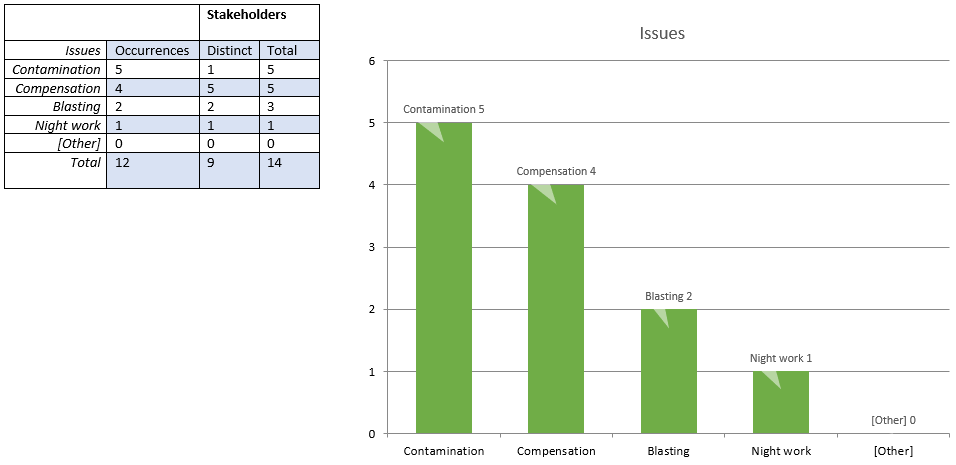
Within Microsoft Word, you also have the ability to customise your charts. You can perform a number of changes using Word's chart functionality, such as changing the chart type and colours.
For detailed steps on generating a Statistics Report, see this article.
Last Modified: 29/10/2025
