What is the mapping feature?
Maps are our feature-rich version mapping tool.
Required System Role: Standard User
Required Team Role: Team Leader
Here are some features of our new Mapping tool:
Customise the look of your map
Each Project has a base map that can be customised with a default position and theme. Your Project's Team Leader can customise the default Project Base Map for the system and you will be able to further customise it for your personal use.
You can choose between six default map options or make a custom one from mapbox.com.
Some things you may like to show on your project base map include city plans, zoning information, current and proposed roads, project zones and buffer zones. If you have an internal mapping team they may also be able to provide custom geoJSON or shapefiles for your map.
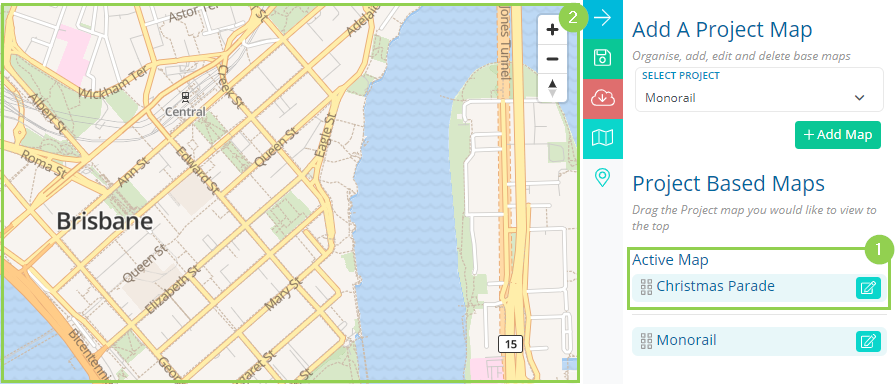
NOTE: You can only have one active base map (1) at a time. The active base map is displayed on the left (2).

Display multiple searches simultaneously using Layers
Layers are pre-set searches that are visually displayed on your map. Any mappable record (contains an address) can be plotted as part of a Layer.
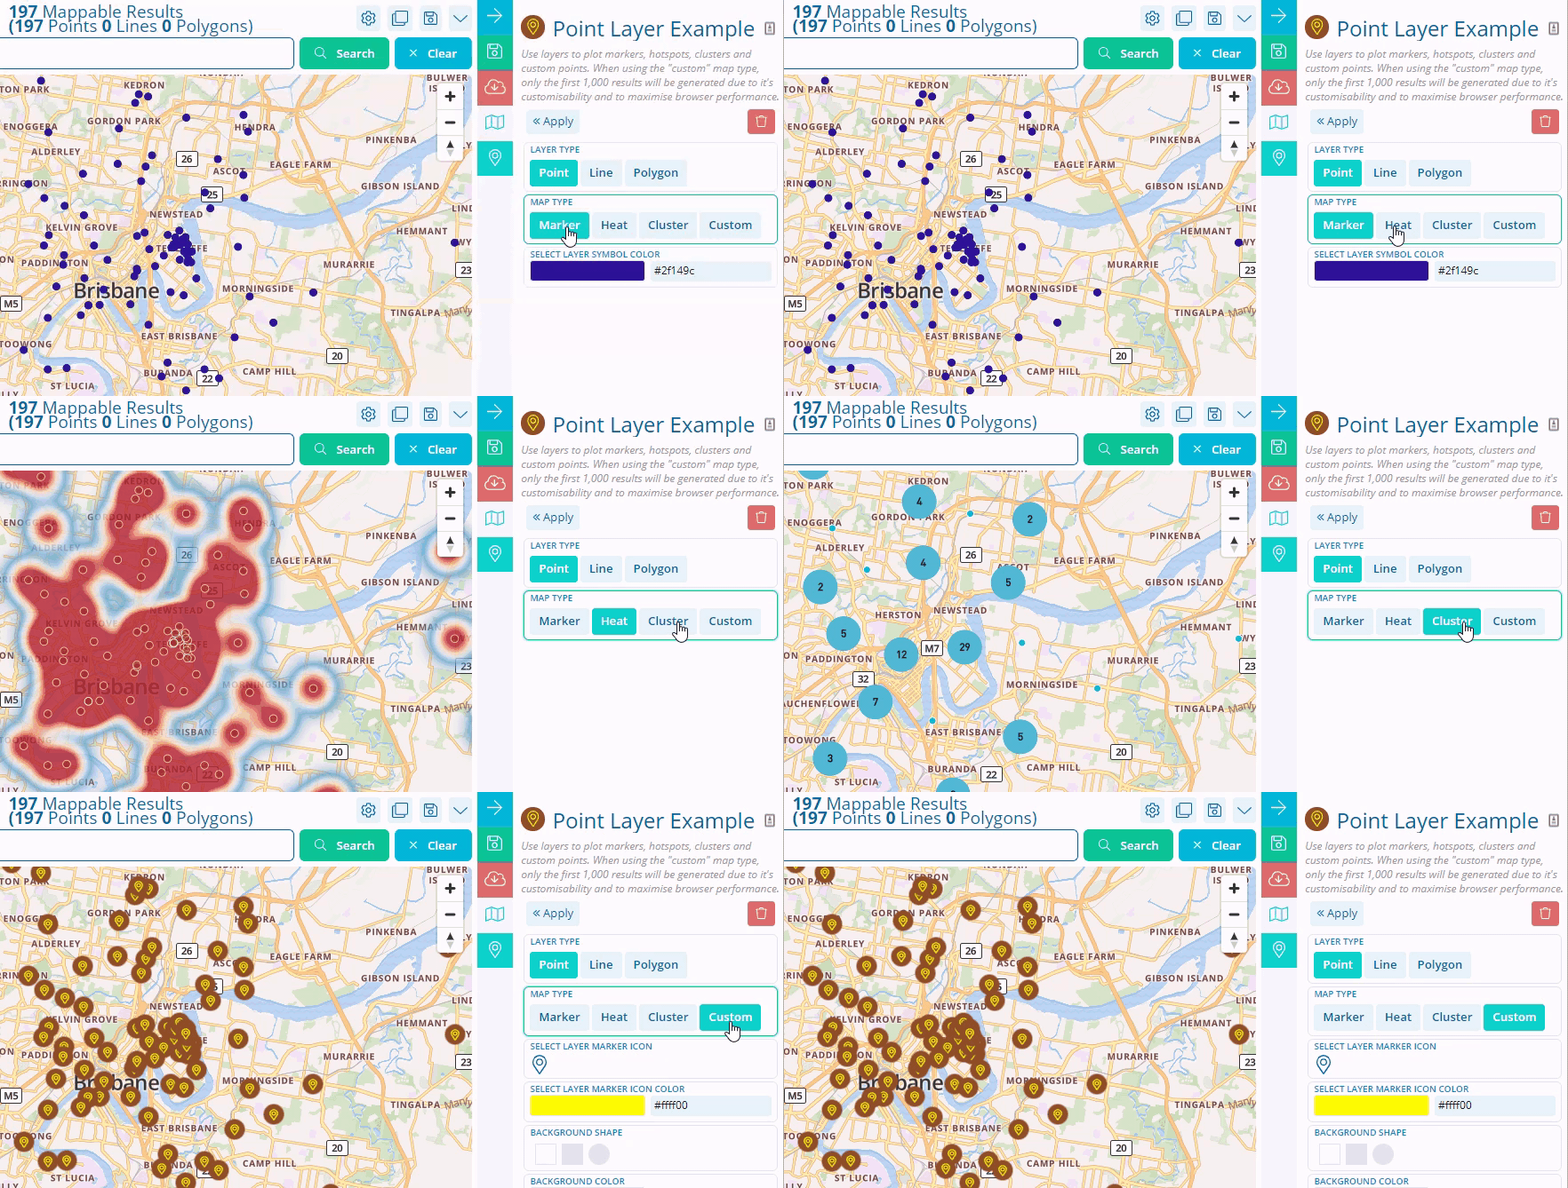
Layers can include one Record type each, and different Record types can be compared across layers. To differentiate your Layers, you can also customize the icons, or use the heatmap or cluster format.
Some example Layers might be:
-
Layer 1: Icons that display Stakeholders belonging to the Stakeholder Group "Key Stakeholders"
-
Layer 2: A heat map that displays Stakeholders related to an Event with a negative Sentiment.
-
Layer 3: Icons that display Properties belonging to the Property Group "Neighboring Properties"
-
Layer 4: A cluster map of all Stakeholders in my system that belong to the Distribution List "General Updates"
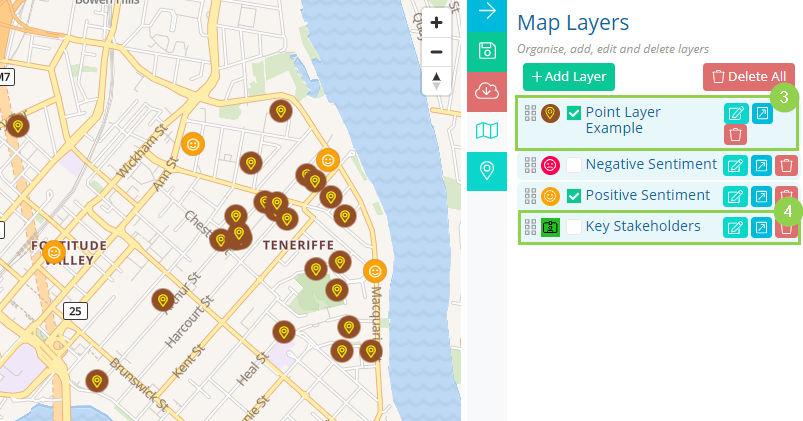
Layers can be selected (3) or deselected (4) to give you a simultaneous visual representation of how one part of your data interacts with the other part of your data.

See below for different visual representations of layers.

In summary, Maps will allow your Users to:
-
Identify hot spots for certain issues and high-activity areas
-
Plot Project data against your custom Project base map
-
Compare and contrast data across Layers
NOTE: All changes made to the Project Base Map are automatically saved locally on your browser. This means using a different computer or clearing your cache will remove your map settings. However, your Layer settings can be saved to the database.
Original Map View
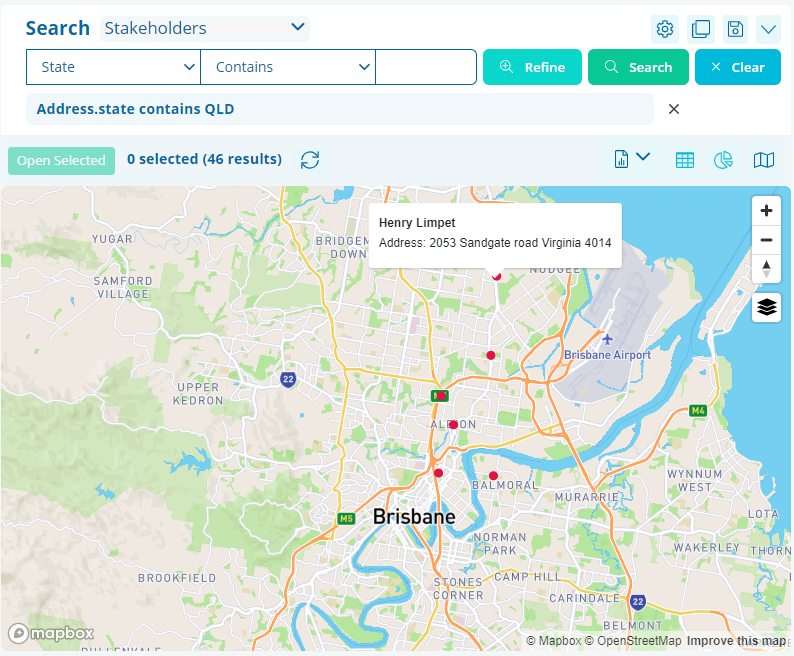
Our original Map view, which you can still access through search, allows you to see addresses from your data plotted out on a map as a red dot. The map view is useful but has some limitations.
-
Cannot display multiple searches simultaneously.
-
Cannot display searches across multiple entities simultaneously

